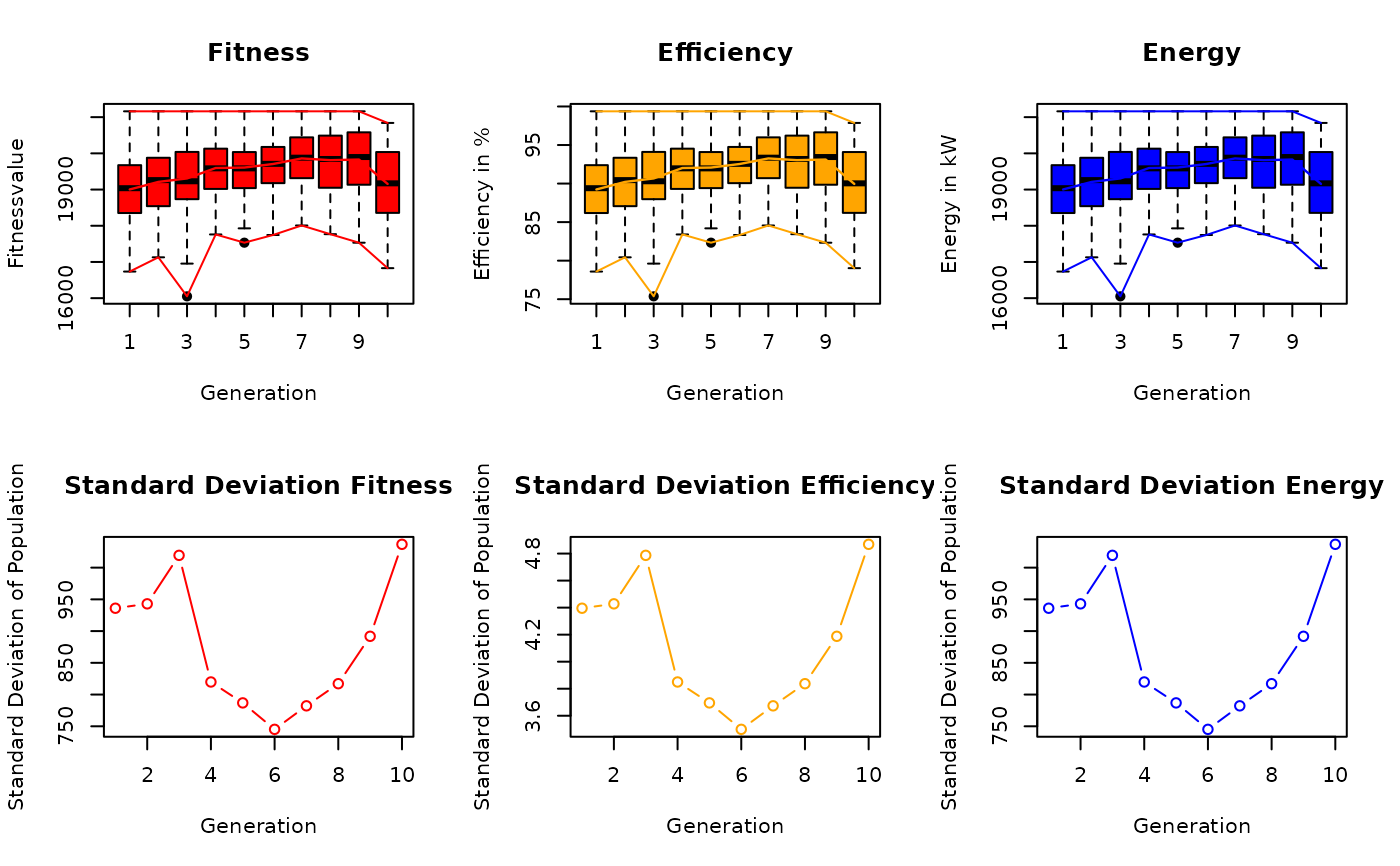
Plot the fitness, efficiency and energy outputs of all generations and the corresponding standard deviations.
Arguments
- result
The output of
genetic_algorithm- pl
Should the results be plotted? Default is FALSE
Value
Returns a data.frame with the values for fitness, efficiency and energy for all evaluated individuals
See also
Other Plotting Functions:
plot_development(),
plot_evolution(),
plot_fitness_evolution(),
plot_parkfitness(),
plot_result(),
plot_windfarmGA(),
plot_windrose(),
random_search_single()