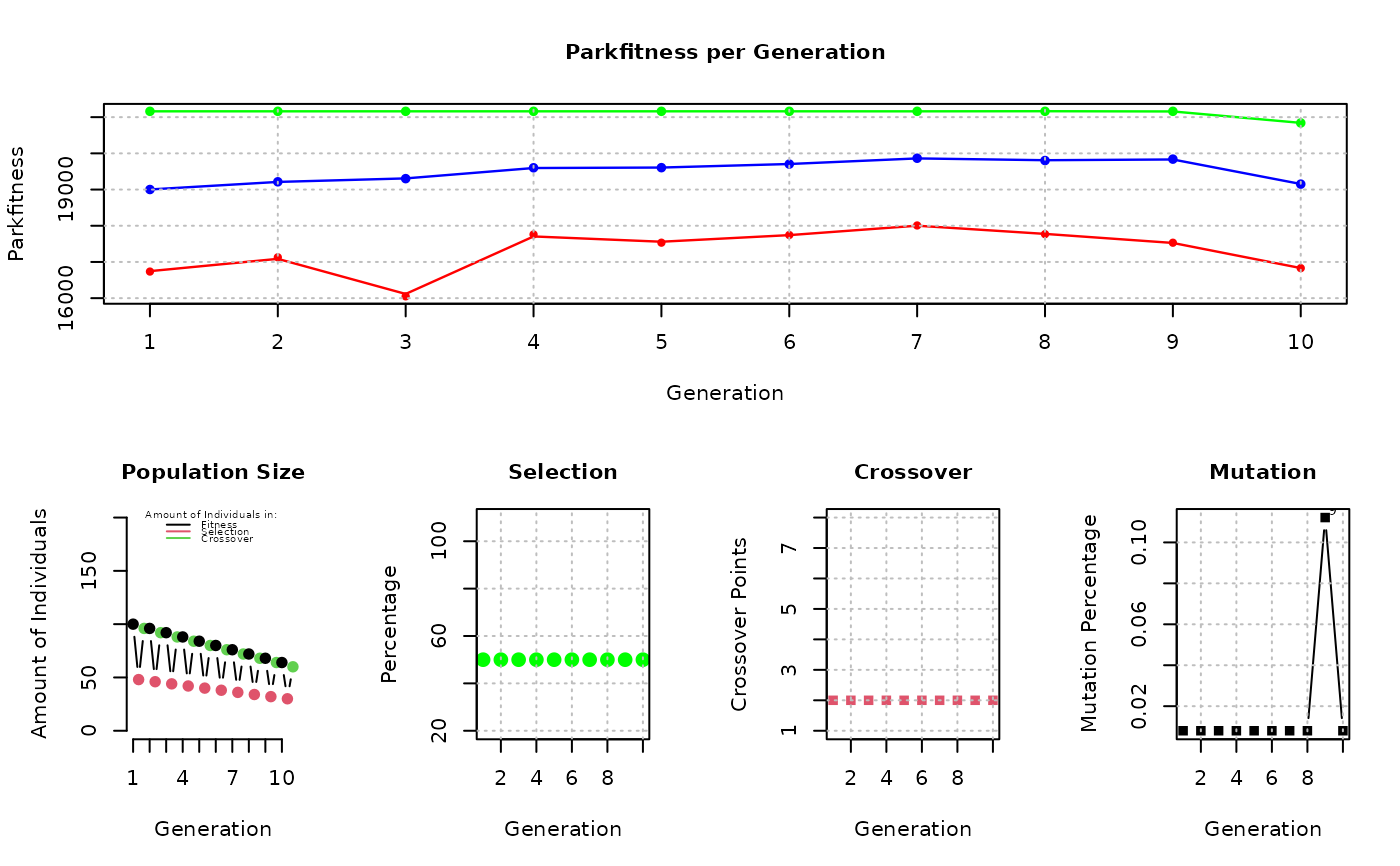
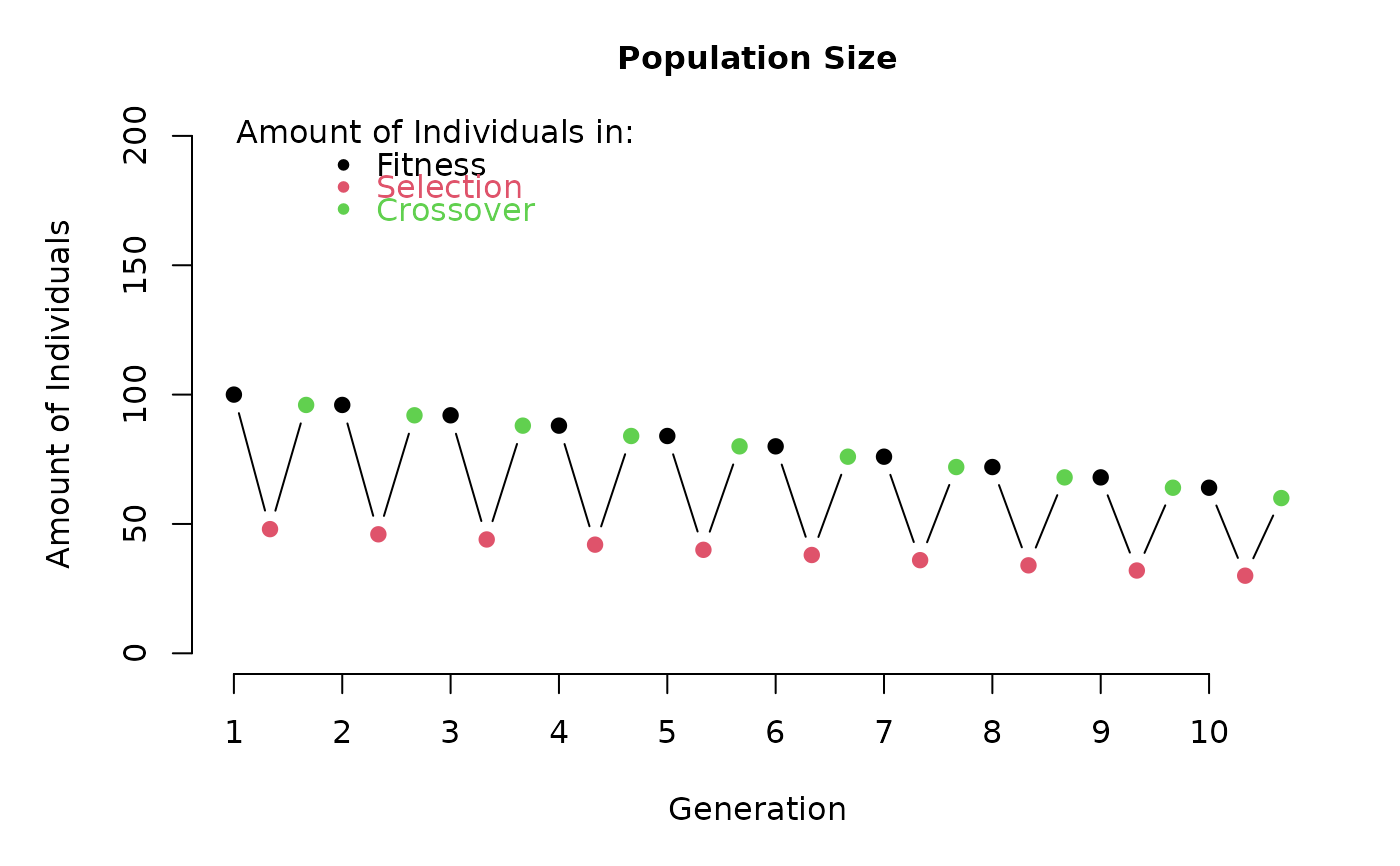
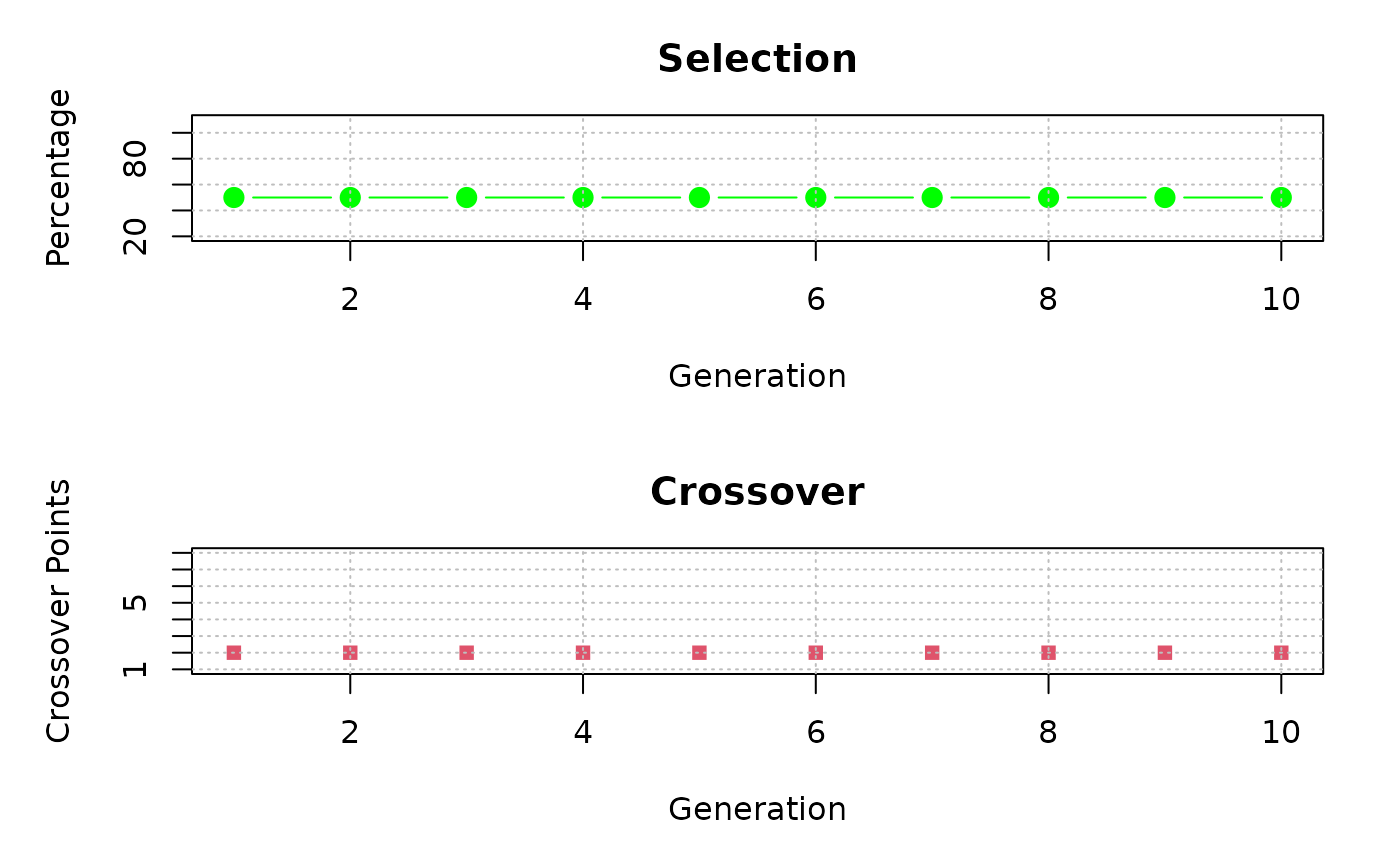
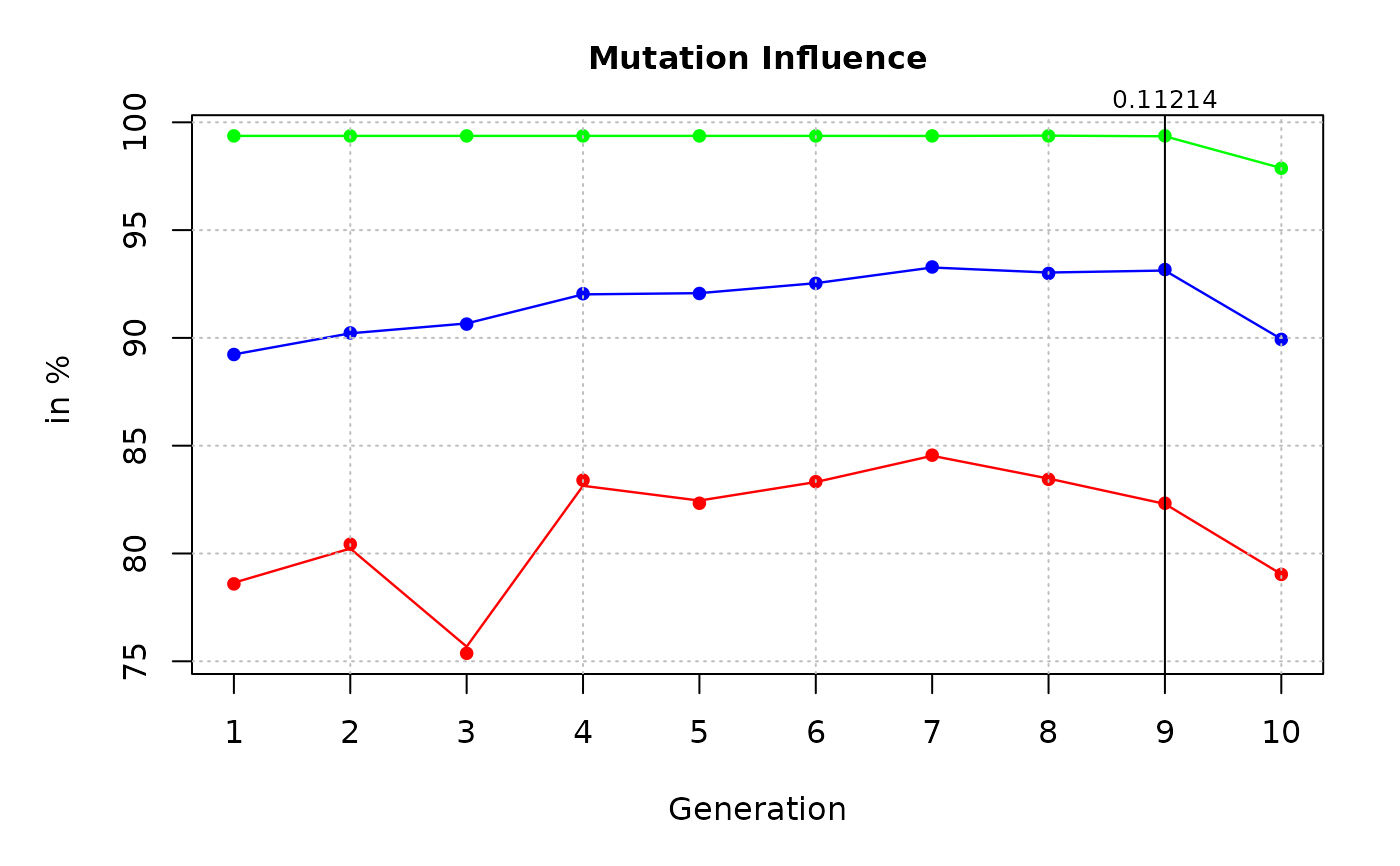
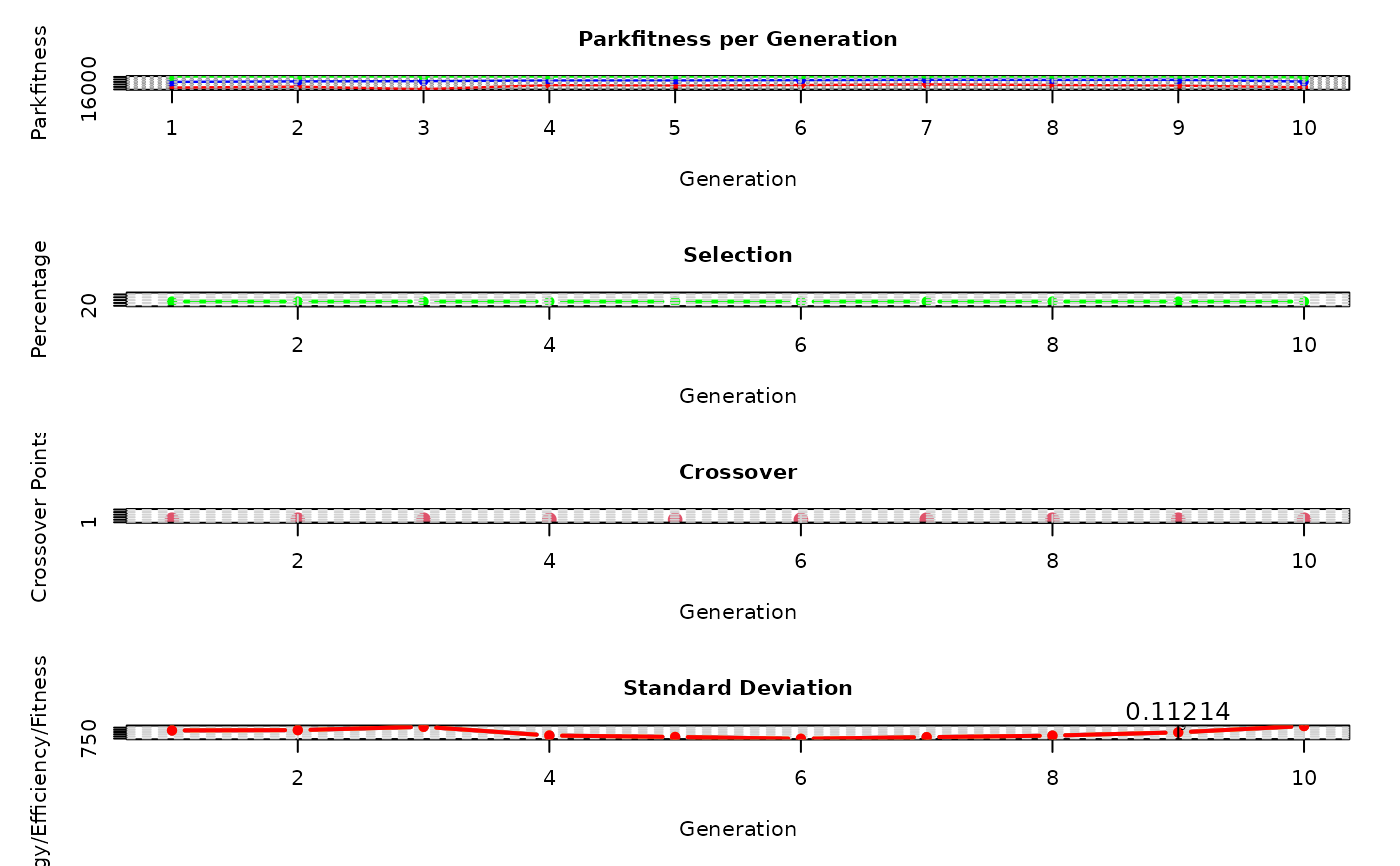
Plot the evolution of fitness values with the influences of selection, crossover and mutation.
Arguments
- result
The output of
genetic_algorithm- spar
A numeric value determining how exact a spline should be drawn. Default is 0.1
See also
Other Plotting Functions:
plot_cloud(),
plot_development(),
plot_evolution(),
plot_fitness_evolution(),
plot_result(),
plot_windfarmGA(),
plot_windrose(),
random_search_single()