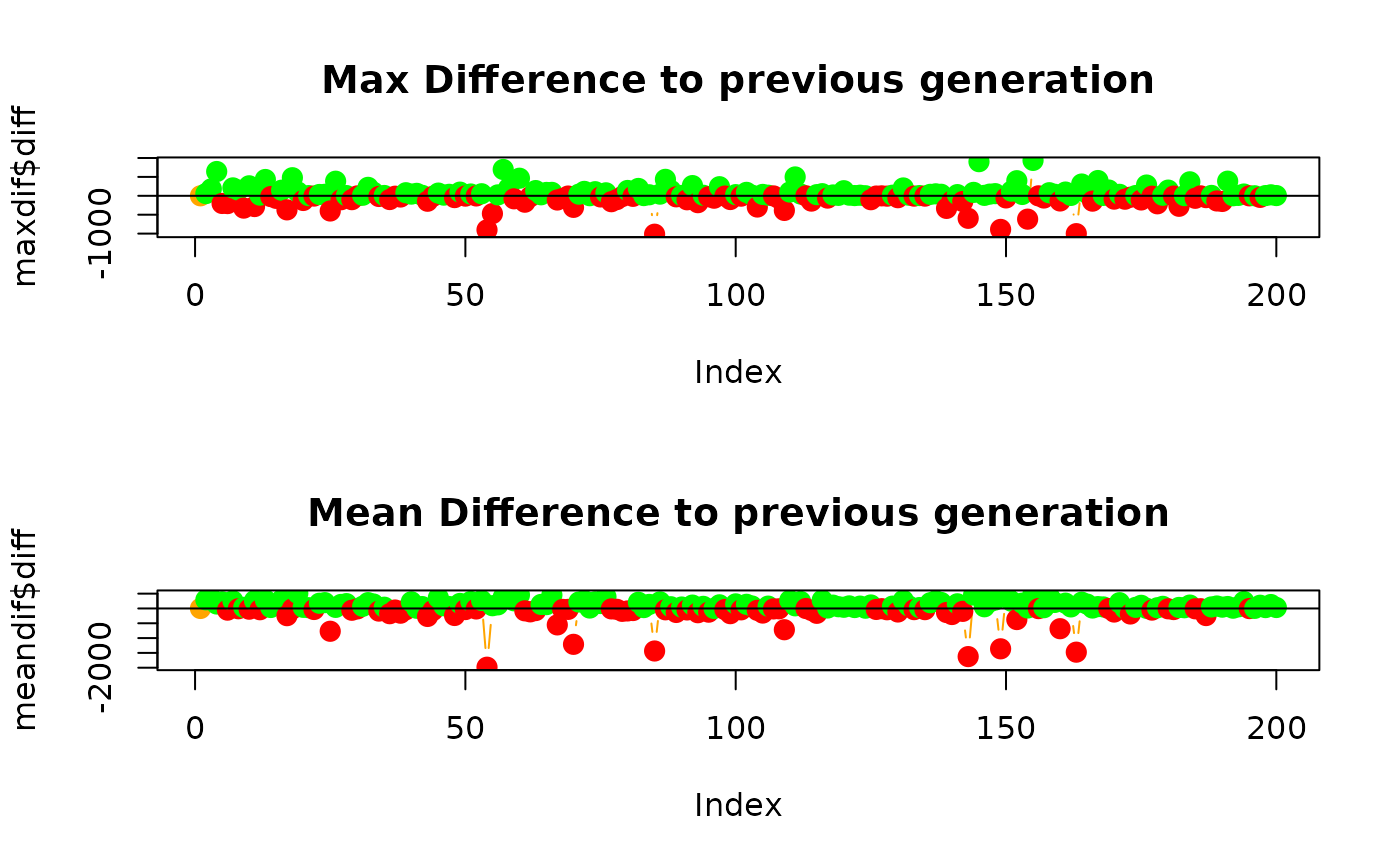
Change of the generation-best fitness. Green = new record, orange = flat, red = worse. Blue line is the share of grid cells visited so far.
Arguments
- result
The output of
genetic_algorithm
Change of the generation-best fitness. Green = new record, orange = flat, red = worse. Blue line is the share of grid cells visited so far.
The output of genetic_algorithm