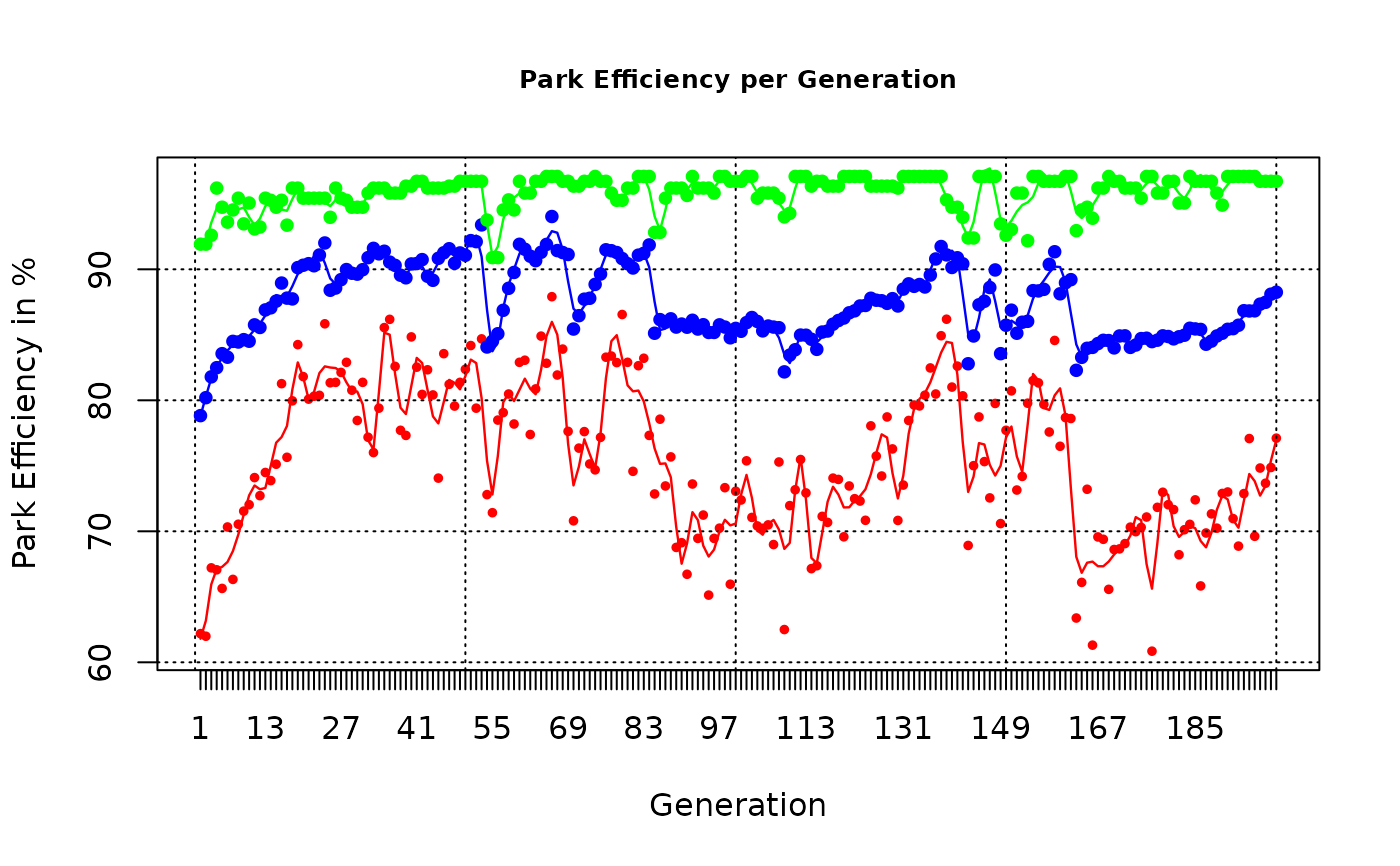
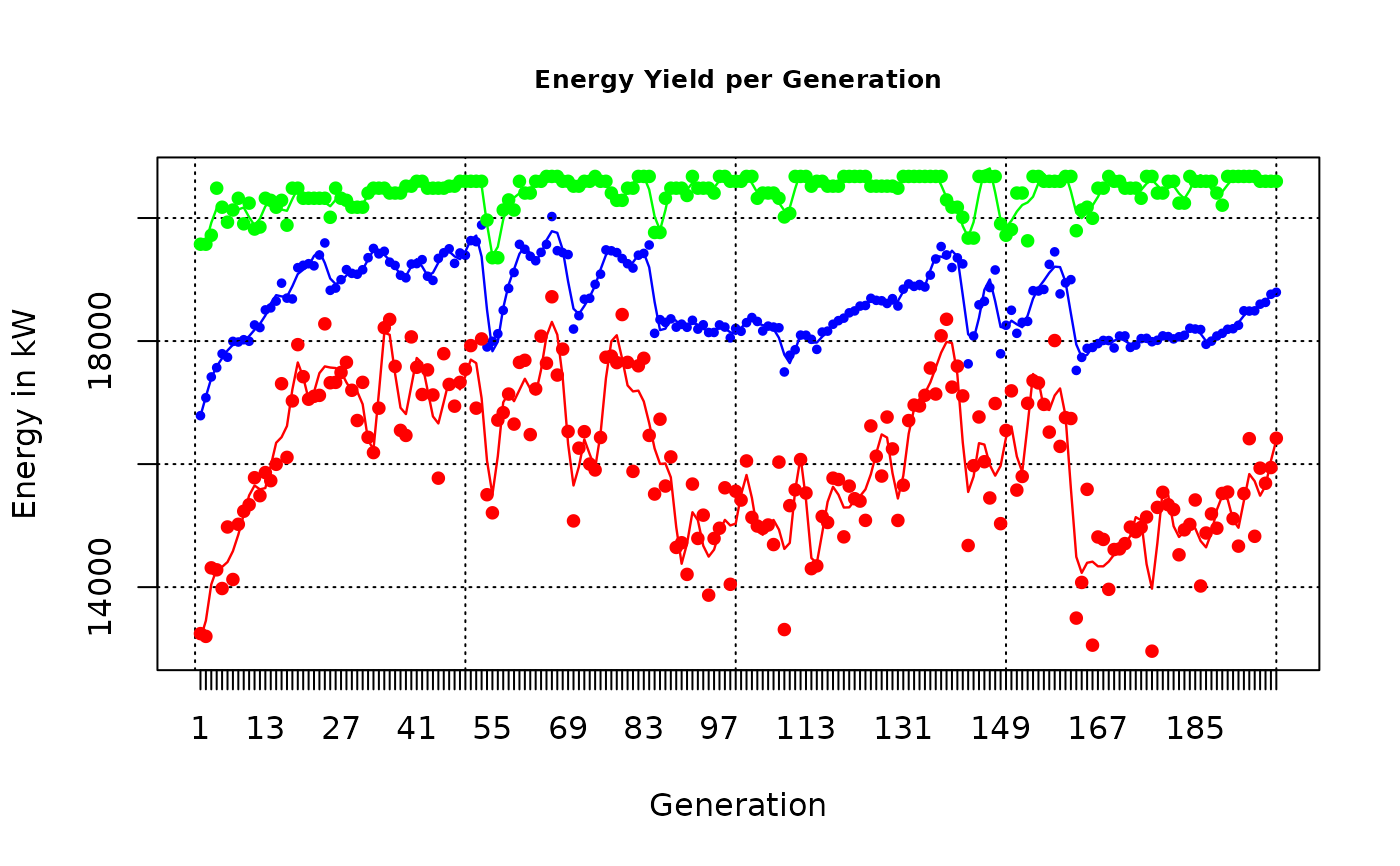
Plot the evolution of energy outputs and efficiency rates over the whole generations. Plots min, mean and max values.
Arguments
- result
The output of
genetic_algorithm- ask
Should R wait for interaction for subsequent plotting. Default is TRUE
- spar
A numeric value determining how exact a spline should be drawn. Default is 0.1
See also
Other Plotting Functions:
plot_cloud(),
plot_development(),
plot_fitness_evolution(),
plot_parkfitness(),
plot_result(),
plot_windfarmGA(),
plot_windrose(),
random_search_single()