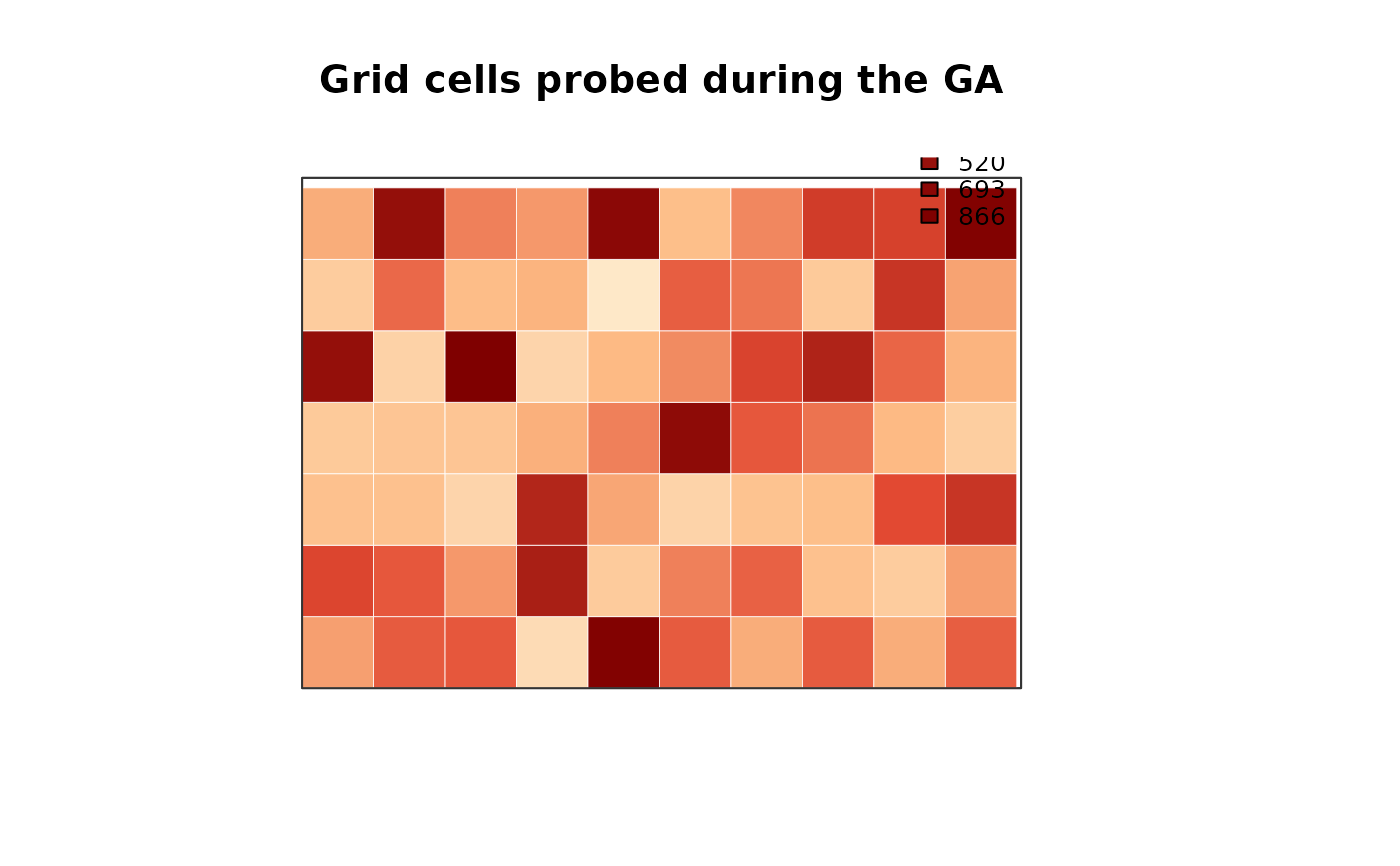
Count how often each grid cell appeared in an evaluated layout
over all generations (allCoords in the GA result). Never-tried cells
stay light gray. Useful to see whether the search covered the area or
stuck to a few sites.
Arguments
- result
The output of
genetic_algorithm- area
Site polygon (
sf, SpatialPolygons, or coordinate matrix). Must be projected in metres.- log
If
TRUE, color the counts on alog1pscale so a few elite cells do not dominate the palette. Default isTRUE- plot
Deprecated alias for
plot.