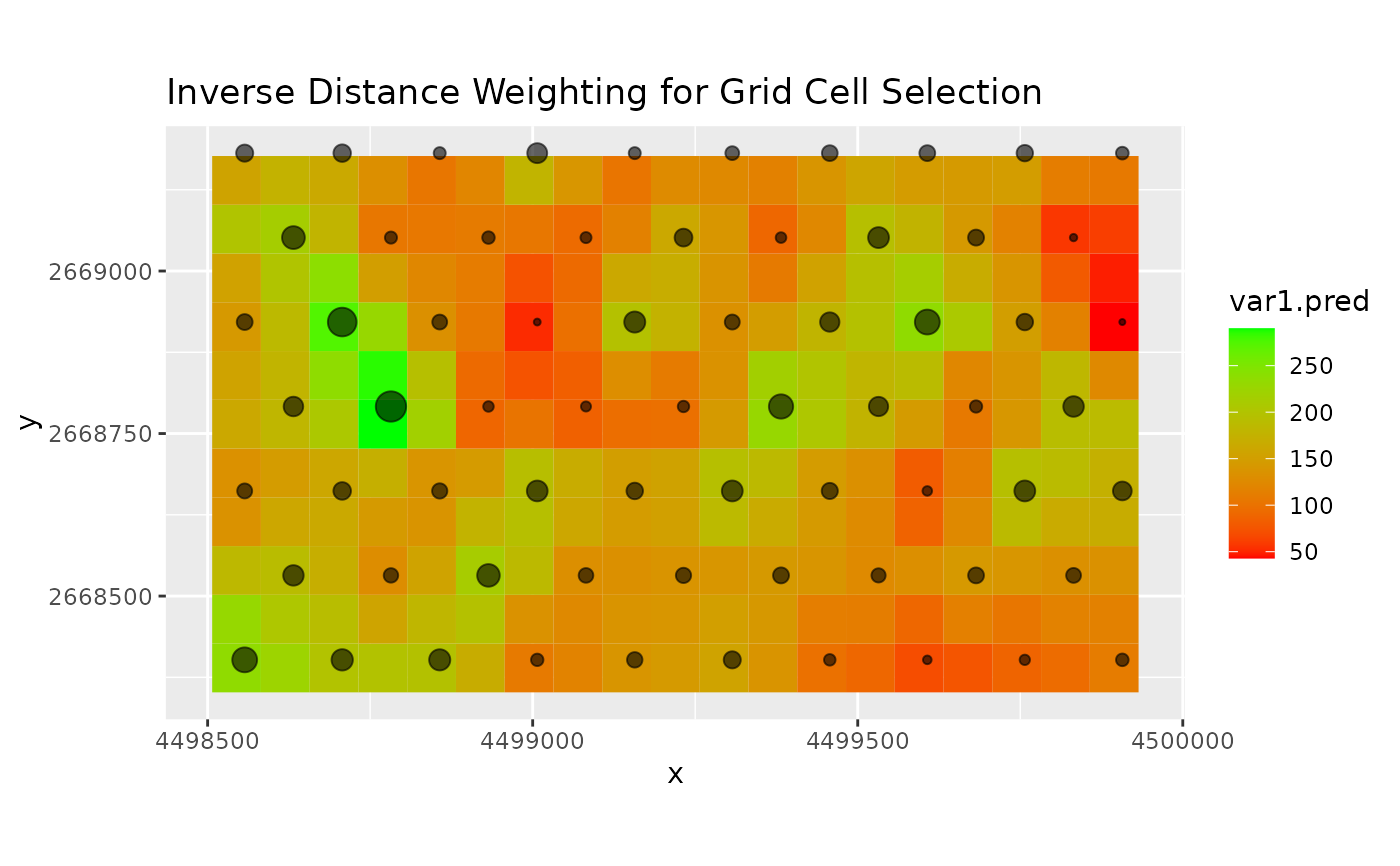
Plot a heatmap of selected grid cells. Green grid cells have been selected more often than red grid cells.
Arguments
- result
The output of
windfarmGAorgenetic_algorithm- si
A numeric value that is used for the sizing of the resolution of the heatmap. Default is 2
- idistw
The inverse distance weighting power. Default is the rotor radius from the 'result' values
Value
Invisibly returns a list with the result of the inverse distance weighting and an aggregated dataframe of all grid cells
See also
Other Plotting Functions:
interpol_view(),
plot_cloud(),
plot_development(),
plot_evolution(),
plot_fitness_evolution(),
plot_parkfitness(),
plot_result(),
plot_viewshed(),
plot_windfarmGA(),
plot_windrose(),
random_search_single()